

Hyperspectral Image Hybrid Convolution Classification under Multi-Feature Fusion
-
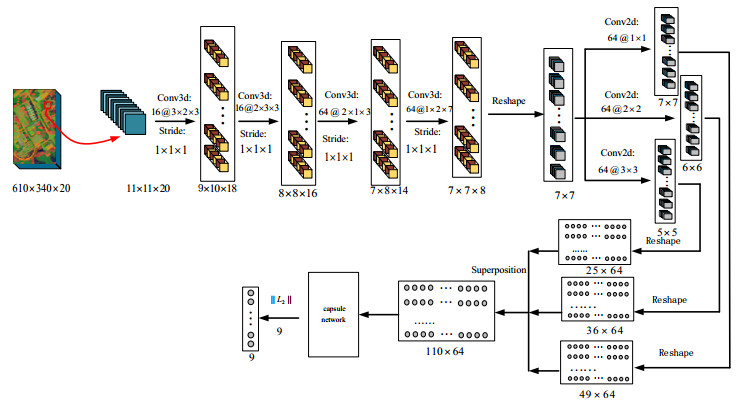
摘要: 针对现有高光谱遥感图像卷积神经网络分类算法空谱特征利用率不足的问题,提出一种多特征融合下基于混合卷积胶囊网络的高光谱图像分类策略。首先,联合使用主成分分析和非负矩阵分解对高光谱数据集进行降维;然后,将降维所得主成分通过超像素分割和余弦聚类生成一个多维特征集;最后,将叠加后的特征集通过二维、三维多尺度混合卷积网络进行空谱特征提取,并使用胶囊网络对其进行分类。通过在不同高光谱数据集下的实验结果表明,在相同20维光谱维度下,所提策略相比于传统分类策略在总体精度、平均精度以及Kappa系数上均有明显提升。Abstract: To address the problem of insufficient utilization of spatial-spectrum features in existing convolutional neural network classification algorithms for hyperspectral remote sensing images, we propose a hyperspectral image classification strategy based on a hybrid convolution capsule network under multi-feature fusion. First, a combination of principal component analysis and non-negative matrix decomposition is used to reduce the dimensionality of a hyperspectral dataset. Second, the principal components obtained through dimensionality reduction are used to generate a multidimensional feature set through super-pixel segmentation and cosine clustering. Finally, the superimposed feature set is used to extract spatial-spectrum features through a two-dimensional and three-dimensional multi-scale hybrid convolutional network, and a capsule network is used to classify them. We performed experiments on different hyperspectral datasets, and the results revealed that under the same 20-dimensional spectral setting, the proposed strategy significantly improves the overall accuracy, average accuracy, and Kappa coefficient compared to traditional classification strategies.
-

图 1 Pavia University数据集PCA降维成分方差比例分布图
Figure 1. The distribution of variance ratio of PCA dimension reduction components in Pavia University dataset

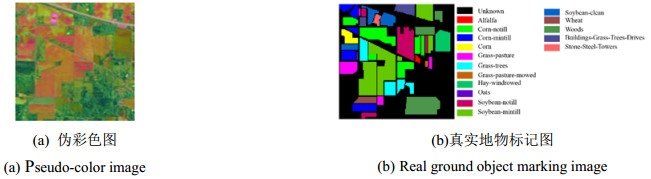
图 6 Indian Pines伪彩色图及其标记图
Figure 6. Pseudo-color map of Indian Pines and its marker map

图 7 各算法在Indian Pines数据集10%训练样本下分类图像
Figure 7. Each algorithm classifies images under 10% of the training samples in the Indian Pines dataset

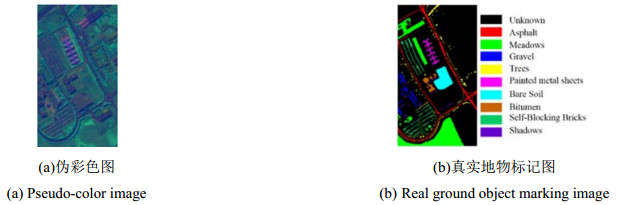
图 8 Pavia University伪彩色图及其标记图
Figure 8. Pseudo-color map of Pavia University and its marker map

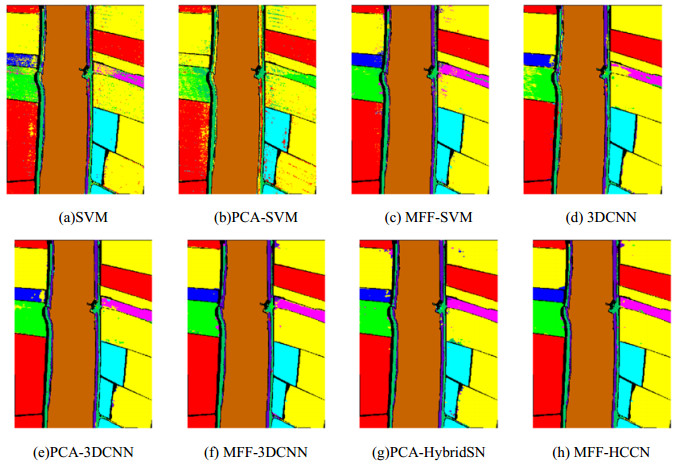
图 9 各算法在Pavia University数据集2%训练样本下分类图像
Figure 9. Each algorithm classifies images under 2% of the training samples in the Pavia University dataset

图 10 WHU-Hi-Longkou伪彩色图及其标记图
Figure 10. Pseudo-color map of WHU-Hi-Longkou and its marker map

图 11 各算法在WHU-Hi-Longkou数据集0.5%训练样本下分类图像
Figure 11. Each algorithm classifies images under 0.5% of the training samples in the WHU-Hi-Longkou dataset

图 12 不同训练样本下的总体分类精度OA曲线图
Figure 12. OA curves of overall classification accuracy under different training samples
表 1 Pavia University数据集卷积分类各层的参数
Table 1. Parameters of each layer of convolutional classification of Pavia University dataset
Network layer (type) Convolution kernel Stride Parameter Output Input layer
Conv3D layer1
Conv3D layer2
Conv3D layer3
Conv3D layer4
Reshape1
Conv2D layer1
Reshape2
Conv2Dlayer2
Reshape3
Conv2Dlayer3
Reshape
Concatenate
Capsule
Output layer
(3, 2, 3, 16)
(2, 3, 3, 16)
(2, 1, 3, 64)
(1, 2, 7, 64)
(1, 1, 64)
(2, 2, 64)
(3, 3, 64)
(1, 1, 1)
(1, 1, 1)
(1, 1, 1)
(1, 1, 1)
(1, 1)
(1, 1)
(1, 1)
0
304
4624
6208
57408
0
32832
0
131136
0
294976
0
0
9216
(11, 11, 20)
(9, 10, 18)
(8, 8, 16)
(7, 8, 14)
(7, 7, 8)
(7, 7)
(7, 7)
(49, 64)
(6, 6)
(36, 64)
(5, 5)
(25, 64)
(110, 64)
(9, 16)
9 下载: 导出CSV
表 2 Indian Pines数据集的地物类别和样本数
Table 2. Land cover classes and numbers of samples in Indian Pines dataset
No. Class name Numbers of samples 1
2
3
4
5
6
7
8
9
10
11
12
13
14
15
16Alfalfa
Corn-notill
Corn-min
Corn
Grass-pasture
Grass-trees
Grass-pasture-mowed
Hay-windrowed
Oats
Soybean-notill
Soybean-mintill
Soybean-clean
Wheat
Woods
Buildings-grass-trees-crives
Stone-steel-towers46
1428
830
237
483
730
28
478
20
972
2455
593
205
1265
386
93Total 10249
下载: 导出CSV
表 3 Pavia University数据集的地物类别和样本数
Table 3. Land cover classes and numbers of samples in Pavia University dataset
No. Class name Numbers of samples 1
2
3
4
5
6
7
8
9Asphalt
Meadows
Gravel
Trees
Painted metal sheets
Bare soil
Bitumen
Self-blocking bricks
Shadows6631
18649
2099
3064
1345
5029
1330
3682
947Total 42776
下载: 导出CSV
表 4 WHU-Hi-Longkou数据集的地物类别和样本数
Table 4. Land cover classes and numbers of samples in WHU- Hi-Longkou dataset
No. Class name Numbers of samples 1
2
3
4
5
6
7
8
9Corn
Cotton
Sesame
Broad-leaf soybean
Narrow-leaf soybean
Rice
Water
Roads and houses
Mixed weed34511
8374
3031
63212
4151
11854
67056
7124
5229Total 204542
下载: 导出CSV
表 5 各算法在Indian Pines数据集10%训练样本下的分类结果比较
Table 5. Comparison of the classification results of each algorithm under 10% training samples of the Indian Pines dataset
SVM PCA-SVM MFF-SVM 3DCNN PCA-3DCNN MFF-3DCNN PCA-Hybrid SN MFF-HCCN OA(%)
AA(%)
Kappa×10080.369
75.027
77.49365.431
54.874
59.30689.442
86.284
87.96491.09
90.443
89.74386.101
80.647
84.13492.926
94.204
91.94396.758
95.871
96.30999.230
97.795
99.123Train times/s 590.3 275.2 275.2 248.2 733.4
下载: 导出CSV
表 6 各算法在Pavia University数据集2%训练样本下分类结果比较
Table 6. Comparison of the classification results of each algorithm under 2% training samples of the Pavia University dataset
SVM PCA-SVM MFF-SVM 3DCNN PCA-3DCNN MFF-3DCNN PCA-HybridSN MFF-HCCN OA(%)
AA(%)
Kappa$ \times $10091.913
88.899
89.20478.147
64.517
69.41795.274
93.946
93.69993.338
90.960
91.13795.840
94.157
94.47597.674
96.386
96.90497.941
97.304
97.26799.253
98.621
99.010Train times/s - - - 366.6 256.2 256.2 212.9 574.4
下载: 导出CSV
表 7 各算法在WHU-Hi-Longkou数据集0.5%训练样本下分类结果比较
Table 7. Comparison of the classification results of each algorithm under 0.5% training samples of the WHU-Hi-Longkou dataset
SVM PCA-SVM MFF-SVM 3DCNN PCA-3DCNN MFF-3DCNN PCA-HybridSN MFF-HCCN OA(%)
AA(%)
Kappa$ \times $10095.036
83.133
93.43788.933
58.389
85.38898.032
94.894
97.40094.233
83.464
92.40998.336
98.736
95.16398.759
96.309
98.36998.716
97.233
98.31599.024
97.278
98.718Train times/s - - - 491.2 382.1 382.1 353.9 816.3
下载: 导出CSV
-
[1] 蓝金辉, 邹金霖, 郝彦爽, 等. 高光谱遥感图像混合像元分解研究进展[J]. 遥感学报, 2018, 22(1): 13-27. https://www.cnki.com.cn/Article/CJFDTOTAL-YGXB201801002.htmLAN J, ZOU J, HAO Y, et al. Research progress on unmixing of hyperspectral remote sensing imagery[J]. Journal of Remote Sensing, 2018, 22(1): 13-27. https://www.cnki.com.cn/Article/CJFDTOTAL-YGXB201801002.htm [2] 徐金环, 沈煜, 刘鹏飞, 等. 联合核稀疏多元逻辑回归和TV-L1错误剔除的高光谱图像分类算法[J]. 电子学报, 2018, 46(1): 175-184. doi: 10.3969/j.issn.0372-2112.2018.01.024XU J, SHEN Y, LIU P, et al. Hyperspectral image classification combining kernel sparse multinomial logistic regression and TV-L1 error rejection[J]. Acta Electronica Sinica, 2018, 46(1): 175-184. doi: 10.3969/j.issn.0372-2112.2018.01.024 [3] 刘启超, 肖亮, 刘芳, 等. SSC DenseNet: 一种空-谱卷积稠密网络的高光谱图像分类算法[J]. 电子学报, 2020, 48(4): 751-762. doi: 10.3969/j.issn.0372-2112.2020.04.017LIU Q, XIAO L, LIU F, et al. SSC DenseNet: a spectral-spatial convolutional dense network for hyperspectral image classification[J]. Acta Electronica Sinica, 2020, 48(4): 751-762. doi: 10.3969/j.issn.0372-2112.2020.04.017 [4] LI S, SONG W, FANG L, et al. Deep learning for hyperspectral image classification: an overview[J]. IEEE Transactions on Geoscience and Remote Sensing, 2019, 57(9): 6690-6709. doi: 10.1109/TGRS.2019.2907932 [5] Nanjun H, Paoletti M E, Mario H J, et al. Feature extraction with multiscale covariance maps for hyperspectral image classification[J]. IEEE Transactions on Geoscience & Remote Sensing, 2018, 57(2): 755-769. [6] GAO H, LIN S, LI C, et al. Application of hyperspectral image classification based on overlap pooling[J]. Neural Processing Letters, 2019, 49(3): 1335-1354. doi: 10.1007/s11063-018-9876-7 [7] YU C, ZHAO M, SONG M, et al. Hyperspectral image classification method based on CNN architecture embedding with hashing semantic feature[J]. IEEE Journal of Selected Topics in Applied Earth Observations and Remote Sensing, 2019, 12(6): 1866-1881. doi: 10.1109/JSTARS.2019.2911987 [8] YING L, Haokui Z, QIANG S. Spectral-spatial classification of hyperspectral imagery with 3D convolutional neural network[J]. Remote Sensing, 2017, 9(1): 67-88. doi: 10.3390/rs9010067 [9] HE M, LI B, CHEN H, et al. Multi-scale 3D deep convolutional neural network for hyperspectral image classification[C]//IEEE International Conference on Image Processing, 2017: 3904-3908. [10] Roy S K, Krishna G, Dubey S R, et al. Hybrid SN: exploring 3D-2D CNN feature hierarchy for hyperspectral image classification[J]. IEEE Geoscience and Remote Sensing Letters, 2020, 17(2): 277-281. doi: 10.1109/LGRS.2019.2918719 [11] WEI W, ZHANG J, LEI Z, et al. Deep cube-pair network for hyperspectral imagery classification[J]. Remote Sensing, 2018, 10(5): 783-801. doi: 10.3390/rs10050783 [12] Baisantry M, SAO A K. Band selection using segmented PCA and component loadings for hyperspectral image classification[C]//IEEE International Geoscience and Remote Sensing Symposium, 2019: 3812-3815. [13] ZHANG W, FU K, SUN X, et al. Joint optimisation convex-negative matrix factorisation for multi-modal image collection summarisation based on images and tags[J]. IET Computer Vision, 2018, 13(2): 125-130. [14] Achanta R, Shaji A, Smith K, et al. SLIC superpixels compared to state-of-the-art superpixel methods[J]. IEEE Transactions on Pattern Analysis and Machine Intelligence, 2012, 34(11): 2274-2282. doi: 10.1109/TPAMI.2012.120 [15] Achanta R, Süsstrunk S. Superpixels and polygons using simple non-iterative clustering[C]//IEEE Conference on Computer Vision and Pattern Recognition, 2017: 4895-4904. [16] Sabour S, Frosst N, Hinton G E. Dynamic routing between capsules[C]// Proceedings of the 2017 International Conference on Neural Information Processing Systems, 2017: 3856-3866. [17] ZHONG Y, WANG X, XU Y, et al. Mini-UAV-Borne hyperspectral remote sensing: from observation and processing to applications[J]. IEEE Geoscience and Remote Sensing Magazine, 2018, 6(4): 46-62. -


 点击查看大图

计量
- 文章访问数: 194
- HTML全文浏览量: 45
- PDF下载量: 39
- 被引次数: 0
